Performance Report
Madalytics provides verified educational performance data based on closed personal trades. Nothing on this page constitutes investment advice, a solicitation, or an offer to buy or sell any security. Past performance does not guarantee future results.
Why I Use RCE (Realized Capital Efficiency)
RCE captures what was actually realized — not mark‑to‑market swings or simulated outcomes. It measures how efficiently capital compounds through closed trades, net of fees, deposits, and withdrawals.
This page is an educational transparency report, not a show‑off page.
Realized Capital Efficiency (RCE)
Definition. RCE (Realized Capital Efficiency) measures how efficiently capital has been turned into realized, locked-in profit over time — free from distortions caused by deposits, withdrawals, or unrealized positions. It is the cleanest representation of execution skill over market noise.
| Year | Madalytics RCE (%) | S&P 500 TR (%) | Δ vs S&P (pp) |
|---|---|---|---|
| 2022 | +5.0 | −18.1 | +23.1 |
| 2023 | +15.0 | +26.3 | −11.3 |
| 2024 | +14.0 | +25.0 | −11.0 |
| 2025 | +24.0 | +18.14 | +5.9 |
| 2026 | +6.5 | +1.78 | +4.72 |
| Total (Compounded) | +81.7% | +55.3% | +26.4 |
Summary: From 2022 through 2026, the Madalytics portfolio compounded to +81.7% realized gain versus the S&P 500 Total Return’s +55.3%. That +26.4 percentage-point edge captures the essence of RCE: real profits, verified outcomes, and disciplined execution through changing market regimes.
How RCE Is Computed
RCE quantifies how effectively equity compounded from closed trades — after fees — over time. It neutralizes cash flows so results aren’t inflated by deposits or withdrawals. Only finalized trades feed the metric.
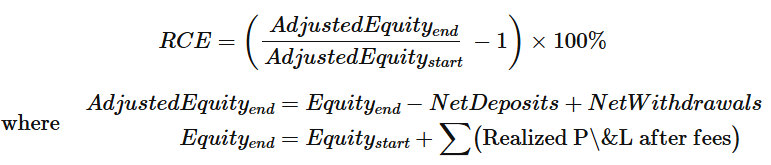
This formulation ensures every percentage shown represents true compounding of realized capital — not paper gains.
Closed Trades (Selected)
Most recent first. This is not an exhaustive list; it highlights a representative set of completed trades since Jan 2025. Screenshots for each trade are provided below as factual evidence of entries and exits. Realized % is based on entry vs. exit price only.
| Ticker | Buy Date | Buy Price | Sell Date | Sell Price | Realized % |
|---|---|---|---|---|---|
| SWK | 2025-07-21 | 70.29 | 2025-08-14 | 73.87 | +5.09% |
| JNJ | 2025-07-15 | 155.29 | 2025-08-14 | 174.47 | +12.35% |
| RNG | 2025-07-15 | 26.32 | 2025-08-14 | 30.14 | +14.51% |
| PEP | 2025-08-05 | 131.25 | 2025-09-03 | 134.63 | +2.58% |
| RIVN | 2025-07-03 | 13.25 | 2025-09-03 | 14.87 | +12.23% |
| TGT | 2025-05-14 | 96.19 | 2025-07-14 | 103.79 | +7.90% |
| ABX.TO | 2025-05-20 | 25.76 | 2025-07-14 | 29.26 | +13.59% |
| EL | 2025-05-27 | 66.05 | 2025-06-25 | 76.21 | +15.38% |
| TTD | 2025-04-25 | 53.57 | 2025-05-27 | 74.67 | +39.39% |
| TROW | 2025-03-17 | 94.17 | 2025-05-20 | 97.49 | +3.53% |
| UA | 2025-02-24 | 6.68 | 2025-05-14 | 5.79 | -13.32% |
| TMF | 2025-04-21 | 37.99 | 2025-04-23 | 40.22 | +5.87% |
| BTCZ | 2025-04-17 | 36.92 | 2025-04-21 | 39.52 | +7.04% |
| SOXL | 2025-04-17 | 9.2 | 2025-04-23 | 10.59 | +15.11% |
| F | 2025-01-28 | 10.01 | 2025-04-25 | 10.06 | +0.50% |
| MANU | 2025-01-24 | 16.34 | 2025-04-25 | 13.86 | -15.18% |
| CHAU | 2025-01-03 | 13.44 | 2025-02-12 | 14.63 | +8.85% |
Interested in how these strategies are executed?
Review access levels, expectations, rules, and the delivery format. Membership is limited and strictly educational.
Madalytics | Institutional & Strategic Correspondence — admin@madalytics.com